Estimate Global Wages with Gloroots’ Salary Calculator

Our salary calculator is used by global employers to pay employees in adherence to local and regional benchmarks. Our data is based on internal surveys conducted with real employees from over 45+ countries.

Country I want to check salary for:
Role that I'm looking for:
Product Manager
Salary
Czech Republic
$
37500
Average Annual Salary
Low
$
25,000
Current
$
37500
High
$
50,000
Market Comparison
Czech Republic
$
37500
USA
$
115000
*Based on standard industry benchmarks 2024
%
%
Product Manager
Salary
New Zealand
$
77500
Average Annual Salary
Low
$
60,000
Current
$
77500
High
$
95,000
Market Comparison
New Zealand
$
77500
USA
$
115000
*Based on standard industry benchmarks 2024
%
%
Product Manager
Salary
Israel
$
77500
Average Annual Salary
Low
$
60,000
Current
$
77500
High
$
95,000
Market Comparison
Israel
$
77500
USA
$
115000
*Based on standard industry benchmarks 2024
%
%
Product Manager
Salary
Mexico
$
30000
Average Annual Salary
Low
$
20,000
Current
$
30000
High
$
40,000
Market Comparison
Mexico
$
30000
USA
$
115000
*Based on standard industry benchmarks 2024
%
%
Product Manager
Salary
Kenya
$
16500
Average Annual Salary
Low
$
8,000
Current
$
16500
High
$
25,000
Market Comparison
Kenya
$
16500
USA
$
115000
*Based on standard industry benchmarks 2024
%
%
Product Manager
Salary
Norway
$
82500
Average Annual Salary
Low
$
65,000
Current
$
82500
High
$
100,000
Market Comparison
Norway
$
82500
USA
$
115000
*Based on standard industry benchmarks 2024
%
%
Product Manager
Salary
Japan
$
70000
Average Annual Salary
Low
$
50,000
Current
$
70000
High
$
90,000
Market Comparison
Japan
$
70000
USA
$
115000
*Based on standard industry benchmarks 2024
%
%
Product Manager
Salary
Indonesia
$
17500
Average Annual Salary
Low
$
10,000
Current
$
17500
High
$
25,000
Market Comparison
Indonesia
$
17500
USA
$
115000
*Based on standard industry benchmarks 2024
%
%
Product Manager
Salary
Netherlands
$
72500
Average Annual Salary
Low
$
55,000
Current
$
72500
High
$
90,000
Market Comparison
Netherlands
$
72500
USA
$
115000
*Based on standard industry benchmarks 2024
%
%
Product Manager
Salary
Kuwait
$
52500
Average Annual Salary
Low
$
35,000
Current
$
52500
High
$
70,000
Market Comparison
Kuwait
$
52500
USA
$
115000
*Based on standard industry benchmarks 2024
%
%
Product Manager
Salary
Italy
$
57500
Average Annual Salary
Low
$
40,000
Current
$
57500
High
$
75,000
Market Comparison
Italy
$
57500
USA
$
115000
*Based on standard industry benchmarks 2024
%
%
Product Manager
Salary
Malaysia
$
30000
Average Annual Salary
Low
$
20,000
Current
$
30000
High
$
40,000
Market Comparison
Malaysia
$
30000
USA
$
115000
*Based on standard industry benchmarks 2024
%
%
Product Manager
Salary
India
$
25000
Average Annual Salary
Low
$
10,000
Current
$
25000
High
$
40,000
Market Comparison
India
$
25000
USA
$
115000
*Based on standard industry benchmarks 2024
%
%
Product Manager
Salary
Nigeria
$
16500
Average Annual Salary
Low
$
8,000
Current
$
16500
High
$
25,000
Market Comparison
Nigeria
$
16500
USA
$
115000
*Based on standard industry benchmarks 2024
%
%
Product Manager
Salary
Switzerland
$
110000
Average Annual Salary
Low
$
90,000
Current
$
110000
High
$
130,000
Market Comparison
Switzerland
$
110000
USA
$
115000
*Based on standard industry benchmarks 2024
%
%
Product Manager
Salary
South Korea
$
60000
Average Annual Salary
Low
$
40,000
Current
$
60000
High
$
80,000
Market Comparison
South Korea
$
60000
USA
$
115000
*Based on standard industry benchmarks 2024
%
%
Product Manager
Salary
Saudi Arabia
$
60000
Average Annual Salary
Low
$
40,000
Current
$
60000
High
$
80,000
Market Comparison
Saudi Arabia
$
60000
USA
$
115000
*Based on standard industry benchmarks 2024
%
%
Product Manager
Salary
Poland
$
37500
Average Annual Salary
Low
$
25,000
Current
$
37500
High
$
50,000
Market Comparison
Poland
$
37500
USA
$
115000
*Based on standard industry benchmarks 2024
%
%
Product Manager
Salary
Romania
$
25000
Average Annual Salary
Low
$
15,000
Current
$
25000
High
$
35,000
Market Comparison
Romania
$
25000
USA
$
115000
*Based on standard industry benchmarks 2024
%
%
Product Manager
Salary
Russia
$
32500
Average Annual Salary
Low
$
20,000
Current
$
32500
High
$
45,000
Market Comparison
Russia
$
32500
USA
$
115000
*Based on standard industry benchmarks 2024
%
%
Product Manager
Salary
Philippines
$
20000
Average Annual Salary
Low
$
10,000
Current
$
20000
High
$
30,000
Market Comparison
Philippines
$
20000
USA
$
115000
*Based on standard industry benchmarks 2024
%
%
Product Manager
Salary
Spain
$
55000
Average Annual Salary
Low
$
40,000
Current
$
55000
High
$
70,000
Market Comparison
Spain
$
55000
USA
$
115000
*Based on standard industry benchmarks 2024
%
%
Product Manager
Salary
Sweden
$
77500
Average Annual Salary
Low
$
60,000
Current
$
77500
High
$
95,000
Market Comparison
Sweden
$
77500
USA
$
115000
*Based on standard industry benchmarks 2024
%
%
Product Manager
Salary
Singapore
$
72500
Average Annual Salary
Low
$
55,000
Current
$
72500
High
$
90,000
Market Comparison
Singapore
$
72500
USA
$
115000
*Based on standard industry benchmarks 2024
%
%
Product Manager
Salary
Qatar
$
60000
Average Annual Salary
Low
$
40,000
Current
$
60000
High
$
80,000
Market Comparison
Qatar
$
60000
USA
$
115000
*Based on standard industry benchmarks 2024
%
%
Product Manager
Salary
South Africa
$
32500
Average Annual Salary
Low
$
20,000
Current
$
32500
High
$
45,000
Market Comparison
South Africa
$
32500
USA
$
115000
*Based on standard industry benchmarks 2024
%
%
Product Manager
Salary
Thailand
$
27500
Average Annual Salary
Low
$
15,000
Current
$
27500
High
$
40,000
Market Comparison
Thailand
$
27500
USA
$
115000
*Based on standard industry benchmarks 2024
%
%
Product Manager
Salary
Ukraine
$
30000
Average Annual Salary
Low
$
20,000
Current
$
30000
High
$
40,000
Market Comparison
Ukraine
$
30000
USA
$
115000
*Based on standard industry benchmarks 2024
%
%
Product Manager
Salary
Turkey
$
27500
Average Annual Salary
Low
$
15,000
Current
$
27500
High
$
40,000
Market Comparison
Turkey
$
27500
USA
$
115000
*Based on standard industry benchmarks 2024
%
%
Product Manager
Salary
UAE
$
70000
Average Annual Salary
Low
$
50,000
Current
$
70000
High
$
90,000
Market Comparison
UAE
$
70000
USA
$
115000
*Based on standard industry benchmarks 2024
%
%
Product Manager
Salary
United Kingdom
$
72500
Average Annual Salary
Low
$
55,000
Current
$
72500
High
$
90,000
Market Comparison
United Kingdom
$
72500
USA
$
115000
*Based on standard industry benchmarks 2024
%
%
Product Manager
Salary
Vietnam
$
20000
Average Annual Salary
Low
$
10,000
Current
$
20000
High
$
30,000
Market Comparison
Vietnam
$
20000
USA
$
115000
*Based on standard industry benchmarks 2024
%
%
Product Manager
Salary
United States
$
115000
Average Annual Salary
Low
$
95,000
Current
$
115000
High
$
135,000
Market Comparison
United States
$
115000
USA
$
*Based on standard industry benchmarks 2024
%
%
QA Engineer
Salary
Colombia
$
11,500
Average Annual Salary
Low
$
5,000
Current
$
11,500
High
$
18,000
Market Comparison
Colombia
$
11,500
USA
$
75000
*Based on standard industry benchmarks 2024
%
%
QA Engineer
Salary
Brazil
$
13,000
Average Annual Salary
Low
$
6,000
Current
$
13,000
High
$
20,000
Market Comparison
Brazil
$
13,000
USA
$
75000
*Based on standard industry benchmarks 2024
%
%
QA Engineer
Salary
Bulgaria
$
20,000
Average Annual Salary
Low
$
10,000
Current
$
20,000
High
$
30,000
Market Comparison
Bulgaria
$
20,000
USA
$
75000
*Based on standard industry benchmarks 2024
%
%
QA Engineer
Salary
Denmark
$
57,500
Average Annual Salary
Low
$
40,000
Current
$
57,500
High
$
75,000
Market Comparison
Denmark
$
57,500
USA
$
75000
*Based on standard industry benchmarks 2024
%
%
QA Engineer
Salary
Czech Republic
$
25,000
Average Annual Salary
Low
$
15,000
Current
$
25,000
High
$
35,000
Market Comparison
Czech Republic
$
25,000
USA
$
75000
*Based on standard industry benchmarks 2024
%
%
QA Engineer
Salary
Argentina
$
13,000
Average Annual Salary
Low
$
6,000
Current
$
13,000
High
$
20,000
Market Comparison
Argentina
$
13,000
USA
$
75000
*Based on standard industry benchmarks 2024
%
%
QA Engineer
Salary
China
$
25,000
Average Annual Salary
Low
$
10,000
Current
$
25,000
High
$
40,000
Market Comparison
China
$
25,000
USA
$
75000
*Based on standard industry benchmarks 2024
%
%
QA Engineer
Salary
Chile
$
20,000
Average Annual Salary
Low
$
10,000
Current
$
20,000
High
$
30,000
Market Comparison
Chile
$
20,000
USA
$
75000
*Based on standard industry benchmarks 2024
%
%
QA Engineer
Salary
Canada
$
65,000
Average Annual Salary
Low
$
45,000
Current
$
65,000
High
$
85,000
Market Comparison
Canada
$
65,000
USA
$
75000
*Based on standard industry benchmarks 2024
%
%
QA Engineer
Salary
Egypt
$
11,000
Average Annual Salary
Low
$
4,000
Current
$
11,000
High
$
18,000
Market Comparison
Egypt
$
11,000
USA
$
75000
*Based on standard industry benchmarks 2024
%
%
QA Engineer
Salary
Australia
$
67,500
Average Annual Salary
Low
$
50,000
Current
$
67,500
High
$
85,000
Market Comparison
Australia
$
67,500
USA
$
75000
*Based on standard industry benchmarks 2024
%
%
QA Engineer
Salary
Japan
$
47,500
Average Annual Salary
Low
$
30,000
Current
$
47,500
High
$
65,000
Market Comparison
Japan
$
47,500
USA
$
75000
*Based on standard industry benchmarks 2024
%
%
QA Engineer
Salary
Indonesia
$
9,500
Average Annual Salary
Low
$
4,000
Current
$
9,500
High
$
15,000
Market Comparison
Indonesia
$
9,500
USA
$
75000
*Based on standard industry benchmarks 2024
%
%
QA Engineer
Salary
Israel
$
52,500
Average Annual Salary
Low
$
35,000
Current
$
52,500
High
$
70,000
Market Comparison
Israel
$
52,500
USA
$
75000
*Based on standard industry benchmarks 2024
%
%
QA Engineer
Salary
France
$
45,000
Average Annual Salary
Low
$
30,000
Current
$
45,000
High
$
60,000
Market Comparison
France
$
45,000
USA
$
75000
*Based on standard industry benchmarks 2024
%
%
QA Engineer
Salary
Finland
$
52,500
Average Annual Salary
Low
$
35,000
Current
$
52,500
High
$
70,000
Market Comparison
Finland
$
52,500
USA
$
75000
*Based on standard industry benchmarks 2024
%
%
QA Engineer
Salary
Italy
$
37,500
Average Annual Salary
Low
$
25,000
Current
$
37,500
High
$
50,000
Market Comparison
Italy
$
37,500
USA
$
75000
*Based on standard industry benchmarks 2024
%
%
QA Engineer
Salary
Hungary
$
19,000
Average Annual Salary
Low
$
10,000
Current
$
19,000
High
$
28,000
Market Comparison
Hungary
$
19,000
USA
$
75000
*Based on standard industry benchmarks 2024
%
%
QA Engineer
Salary
India
$
12,000
Average Annual Salary
Low
$
4,000
Current
$
12,000
High
$
20,000
Market Comparison
India
$
12,000
USA
$
75000
*Based on standard industry benchmarks 2024
%
%
QA Engineer
Salary
Germany
$
55,000
Average Annual Salary
Low
$
40,000
Current
$
55,000
High
$
70,000
Market Comparison
Germany
$
55,000
USA
$
75000
*Based on standard industry benchmarks 2024
%
%
QA Engineer
Salary
Greece
$
21,000
Average Annual Salary
Low
$
12,000
Current
$
21,000
High
$
30,000
Market Comparison
Greece
$
21,000
USA
$
75000
*Based on standard industry benchmarks 2024
%
%
QA Engineer
Salary
Norway
$
60,000
Average Annual Salary
Low
$
40,000
Current
$
60,000
High
$
80,000
Market Comparison
Norway
$
60,000
USA
$
75000
*Based on standard industry benchmarks 2024
%
%
QA Engineer
Salary
Qatar
$
37,500
Average Annual Salary
Low
$
20,000
Current
$
37,500
High
$
55,000
Market Comparison
Qatar
$
37,500
USA
$
75000
*Based on standard industry benchmarks 2024
%
%
QA Engineer
Salary
Kenya
$
7,500
Average Annual Salary
Low
$
3,000
Current
$
7,500
High
$
12,000
Market Comparison
Kenya
$
7,500
USA
$
75000
*Based on standard industry benchmarks 2024
%
%
QA Engineer
Salary
Philippines
$
9,500
Average Annual Salary
Low
$
4,000
Current
$
9,500
High
$
15,000
Market Comparison
Philippines
$
9,500
USA
$
75000
*Based on standard industry benchmarks 2024
%
%
QA Engineer
Salary
Netherlands
$
55,000
Average Annual Salary
Low
$
40,000
Current
$
55,000
High
$
70,000
Market Comparison
Netherlands
$
55,000
USA
$
75000
*Based on standard industry benchmarks 2024
%
%
QA Engineer
Salary
Nigeria
$
7,500
Average Annual Salary
Low
$
3,000
Current
$
7,500
High
$
12,000
Market Comparison
Nigeria
$
7,500
USA
$
75000
*Based on standard industry benchmarks 2024
%
%
QA Engineer
Salary
Malaysia
$
13,000
Average Annual Salary
Low
$
6,000
Current
$
13,000
High
$
20,000
Market Comparison
Malaysia
$
13,000
USA
$
75000
*Based on standard industry benchmarks 2024
%
%
QA Engineer
Salary
Mexico
$
13,500
Average Annual Salary
Low
$
7,000
Current
$
13,500
High
$
20,000
Market Comparison
Mexico
$
13,500
USA
$
75000
*Based on standard industry benchmarks 2024
%
%
QA Engineer
Salary
New Zealand
$
57,500
Average Annual Salary
Low
$
40,000
Current
$
57,500
High
$
75,000
Market Comparison
New Zealand
$
57,500
USA
$
75000
*Based on standard industry benchmarks 2024
%
%
QA Engineer
Salary
Kuwait
$
35,000
Average Annual Salary
Low
$
20,000
Current
$
35,000
High
$
50,000
Market Comparison
Kuwait
$
35,000
USA
$
75000
*Based on standard industry benchmarks 2024
%
%
QA Engineer
Salary
Saudi Arabia
$
35,000
Average Annual Salary
Low
$
20,000
Current
$
35,000
High
$
50,000
Market Comparison
Saudi Arabia
$
35,000
USA
$
75000
*Based on standard industry benchmarks 2024
%
%
QA Engineer
Salary
Spain
$
37,500
Average Annual Salary
Low
$
25,000
Current
$
37,500
High
$
50,000
Market Comparison
Spain
$
37,500
USA
$
75000
*Based on standard industry benchmarks 2024
%
%
QA Engineer
Salary
Switzerland
$
72,500
Average Annual Salary
Low
$
55,000
Current
$
72,500
High
$
90,000
Market Comparison
Switzerland
$
72,500
USA
$
75000
*Based on standard industry benchmarks 2024
%
%
QA Engineer
Salary
Romania
$
16,500
Average Annual Salary
Low
$
8,000
Current
$
16,500
High
$
25,000
Market Comparison
Romania
$
16,500
USA
$
75000
*Based on standard industry benchmarks 2024
%
%
QA Engineer
Salary
Poland
$
25,000
Average Annual Salary
Low
$
15,000
Current
$
25,000
High
$
35,000
Market Comparison
Poland
$
25,000
USA
$
75000
*Based on standard industry benchmarks 2024
%
%
QA Engineer
Salary
Russia
$
16,500
Average Annual Salary
Low
$
8,000
Current
$
16,500
High
$
25,000
Market Comparison
Russia
$
16,500
USA
$
75000
*Based on standard industry benchmarks 2024
%
%
QA Engineer
Salary
Singapore
$
52,500
Average Annual Salary
Low
$
35,000
Current
$
52,500
High
$
70,000
Market Comparison
Singapore
$
52,500
USA
$
75000
*Based on standard industry benchmarks 2024
%
%
QA Engineer
Salary
South Africa
$
20,000
Average Annual Salary
Low
$
10,000
Current
$
20,000
High
$
30,000
Market Comparison
South Africa
$
20,000
USA
$
75000
*Based on standard industry benchmarks 2024
%
%
QA Engineer
Salary
South Korea
$
40,000
Average Annual Salary
Low
$
25,000
Current
$
40,000
High
$
55,000
Market Comparison
South Korea
$
40,000
USA
$
75000
*Based on standard industry benchmarks 2024
%
%
QA Engineer
Salary
UAE
$
42,500
Average Annual Salary
Low
$
25,000
Current
$
42,500
High
$
60,000
Market Comparison
UAE
$
42,500
USA
$
75000
*Based on standard industry benchmarks 2024
%
%
QA Engineer
Salary
Turkey
$
13,000
Average Annual Salary
Low
$
6,000
Current
$
13,000
High
$
20,000
Market Comparison
Turkey
$
13,000
USA
$
75000
*Based on standard industry benchmarks 2024
%
%
QA Engineer
Salary
Ukraine
$
20,000
Average Annual Salary
Low
$
10,000
Current
$
20,000
High
$
30,000
Market Comparison
Ukraine
$
20,000
USA
$
75000
*Based on standard industry benchmarks 2024
%
%
QA Engineer
Salary
United Kingdom
$
50,000
Average Annual Salary
Low
$
35,000
Current
$
50,000
High
$
65,000
Market Comparison
United Kingdom
$
50,000
USA
$
75000
*Based on standard industry benchmarks 2024
%
%
QA Engineer
Salary
United States
$
75,000
Average Annual Salary
Low
$
50,000
Current
$
75,000
High
$
100,000
Market Comparison
United States
$
75,000
USA
$
*Based on standard industry benchmarks 2024
%
%
QA Engineer
Salary
Thailand
$
16,500
Average Annual Salary
Low
$
8,000
Current
$
16,500
High
$
25,000
Market Comparison
Thailand
$
16,500
USA
$
75000
*Based on standard industry benchmarks 2024
%
%
QA Engineer
Salary
Sweden
$
55,000
Average Annual Salary
Low
$
40,000
Current
$
55,000
High
$
70,000
Market Comparison
Sweden
$
55,000
USA
$
75000
*Based on standard industry benchmarks 2024
%
%
QA Engineer
Salary
Vietnam
$
9,500
Average Annual Salary
Low
$
4,000
Current
$
9,500
High
$
15,000
Market Comparison
Vietnam
$
9,500
USA
$
75000
*Based on standard industry benchmarks 2024
%
%
Recruiter
Salary
Brazil
$
32,500
Average Annual Salary
Low
$
15,000
Current
$
32,500
High
$
50,000
Market Comparison
Brazil
$
32,500
USA
$
75000
*Based on standard industry benchmarks 2024
%
%
Recruiter
Salary
Bulgaria
$
30,000
Average Annual Salary
Low
$
15,000
Current
$
30,000
High
$
45,000
Market Comparison
Bulgaria
$
30,000
USA
$
75000
*Based on standard industry benchmarks 2024
%
%
Recruiter
Salary
Canada
$
67,500
Average Annual Salary
Low
$
45,000
Current
$
67,500
High
$
90,000
Market Comparison
Canada
$
67,500
USA
$
75000
*Based on standard industry benchmarks 2024
%
%
Recruiter
Salary
Australia
$
72,500
Average Annual Salary
Low
$
50,000
Current
$
72,500
High
$
95,000
Market Comparison
Australia
$
72,500
USA
$
75000
*Based on standard industry benchmarks 2024
%
%
Recruiter
Salary
Chile
$
37,500
Average Annual Salary
Low
$
20,000
Current
$
37,500
High
$
55,000
Market Comparison
Chile
$
37,500
USA
$
75000
*Based on standard industry benchmarks 2024
%
%
Recruiter
Salary
Argentina
$
30,000
Average Annual Salary
Low
$
15,000
Current
$
30,000
High
$
45,000
Market Comparison
Argentina
$
30,000
USA
$
75000
*Based on standard industry benchmarks 2024
%
%
Recruiter
Salary
France
$
62,500
Average Annual Salary
Low
$
40,000
Current
$
62,500
High
$
85,000
Market Comparison
France
$
62,500
USA
$
75000
*Based on standard industry benchmarks 2024
%
%
Recruiter
Salary
Finland
$
62,500
Average Annual Salary
Low
$
40,000
Current
$
62,500
High
$
85,000
Market Comparison
Finland
$
62,500
USA
$
75000
*Based on standard industry benchmarks 2024
%
%
Recruiter
Salary
Germany
$
67,500
Average Annual Salary
Low
$
45,000
Current
$
67,500
High
$
90,000
Market Comparison
Germany
$
67,500
USA
$
75000
*Based on standard industry benchmarks 2024
%
%
Recruiter
Salary
Czech Republic
$
37,500
Average Annual Salary
Low
$
20,000
Current
$
37,500
High
$
55,000
Market Comparison
Czech Republic
$
37,500
USA
$
75000
*Based on standard industry benchmarks 2024
%
%
Recruiter
Salary
Egypt
$
25,000
Average Annual Salary
Low
$
10,000
Current
$
25,000
High
$
40,000
Market Comparison
Egypt
$
25,000
USA
$
75000
*Based on standard industry benchmarks 2024
%
%
Recruiter
Salary
China
$
42,500
Average Annual Salary
Low
$
20,000
Current
$
42,500
High
$
65,000
Market Comparison
China
$
42,500
USA
$
75000
*Based on standard industry benchmarks 2024
%
%
Recruiter
Salary
Greece
$
42,500
Average Annual Salary
Low
$
25,000
Current
$
42,500
High
$
60,000
Market Comparison
Greece
$
42,500
USA
$
75000
*Based on standard industry benchmarks 2024
%
%
Recruiter
Salary
Colombia
$
26,000
Average Annual Salary
Low
$
12,000
Current
$
26,000
High
$
40,000
Market Comparison
Colombia
$
26,000
USA
$
75000
*Based on standard industry benchmarks 2024
%
%
Recruiter
Salary
India
$
24,000
Average Annual Salary
Low
$
8,000
Current
$
24,000
High
$
40,000
Market Comparison
India
$
24,000
USA
$
75000
*Based on standard industry benchmarks 2024
%
%
Recruiter
Salary
Hungary
$
37,500
Average Annual Salary
Low
$
20,000
Current
$
37,500
High
$
55,000
Market Comparison
Hungary
$
37,500
USA
$
75000
*Based on standard industry benchmarks 2024
%
%
Recruiter
Salary
Italy
$
55,000
Average Annual Salary
Low
$
35,000
Current
$
55,000
High
$
75,000
Market Comparison
Italy
$
55,000
USA
$
75000
*Based on standard industry benchmarks 2024
%
%
Recruiter
Salary
Japan
$
65,000
Average Annual Salary
Low
$
40,000
Current
$
65,000
High
$
90,000
Market Comparison
Japan
$
65,000
USA
$
75000
*Based on standard industry benchmarks 2024
%
%
Recruiter
Salary
Denmark
$
67,500
Average Annual Salary
Low
$
45,000
Current
$
67,500
High
$
90,000
Market Comparison
Denmark
$
67,500
USA
$
75000
*Based on standard industry benchmarks 2024
%
%
Rated 4.9/5

Trusted by Companies around the Globe

What is a Salary calculator?

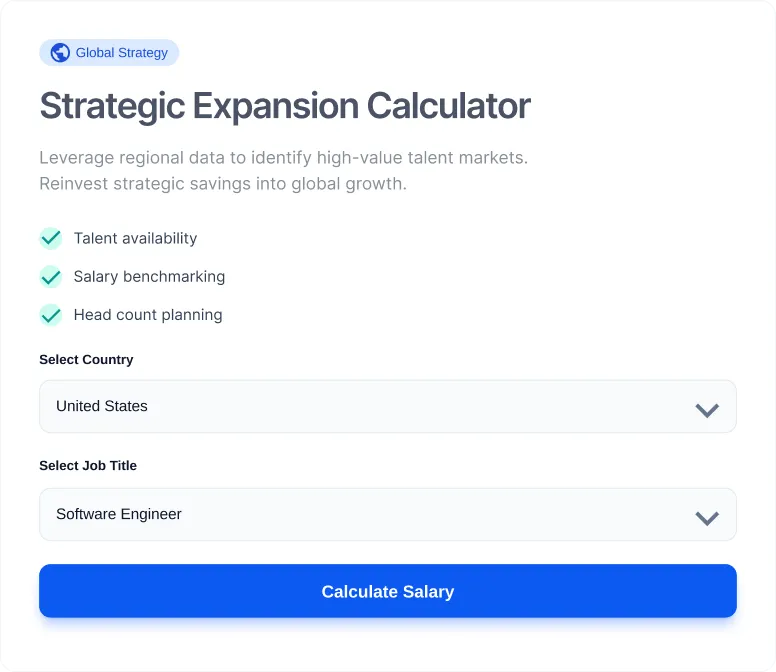
Not sure how & what to pay your foreign employees? Fret not! Gloroots’ global salary calculator will help you determine the right salary based on the employee’s location and designation. By selecting a specific job title and country from the drop-down lists, employers can effortlessly access median salary information for various roles in more than 45 countries. This tool is especially valuable for employers gearing up for global expansion, as it helps in budgeting and strategic planning by offering a clear understanding of global pay scales.

The calculator presents the median salary figures for chosen roles in different nations and the percentage difference from a benchmark country like the United States. For instance, if you select Brazil and the US for a particular role, it will show Brazil's median salary, the US median salary, and the percentage difference between them. This feature is crucial for employers to make informed decisions about compensation, ensuring competitiveness and fairness in the global market.

Benefits of using a Salary calculator

With Gloroots salary calculator,

Pay employees right

Using Gloroots’ global wages calculator data, avoid underpaying your global workforce. Our global salary calculator is developed and updated based on responses from real employees from over 40+ countries.

Real-Time Market Data

Stay ahead in the competitive job market with real-time salary insights. This tool is invaluable for ensuring your compensation packages are competitive and attracting and retaining top talent worldwide.

Compare salaries with the USA

Our salary calculator is programmed to compare salaries for 25+ key roles across 45+ countries against the median salaries of their USA counterparts. This feature is particularly beneficial for understanding market norms and adjusting pay scales accordingly.

Plan salary budgets

One of the biggest concerns in planning salary budgets is accounting for bank transfer charges, currency volatility, etc. With our global salary calculator, employers can forecast salary requirements and prepare salary budgets with credible data.

How this calculator can be used

It’s an essential tool for businesses planning international expansion or managing remote teams across different countries. Employers can use this calculator to explore different low-cost economies to hire from and use the saved finances to focus on growth, employee engagement, benefits, etc. Moreover, employers can ensure employees get competitive salaries in adherence to regional salary benchmarks.

Disclaimer:

The estimated average salary is based on user-submitted data. Actual salaries may vary due to factors like industry, experience, and company size. Note that this figure does not include additional pay forms such as bonuses, commissions, and tips. This estimate is for general informational purposes and should not be the sole basis for financial or career decisions.

FAQs

How does the salary calculator work?

The salary calculator estimates compensation based on the selected country and job role. It compares salary data across multiple markets and benchmarks them against median compensation levels. The results help employers understand typical pay ranges for a role in different regions.

What data is used to calculate the salary estimates?

The calculator uses aggregated salary data from multiple countries, including internal surveys and compensation benchmarks. The insights are based on salary trends reported by employees and employers across 40+ countries, helping provide reliable global benchmarks.

Can the calculator help compare salaries across countries?

Yes. The calculator allows you to compare compensation for the same role across different countries. It also highlights the percentage difference from benchmark markets like the United States, helping employers understand global salary variations.

Who should use a global salary calculator?

A global salary calculator is useful for HR teams, hiring managers, founders, and global employers who hire or manage employees across multiple countries. It helps them make informed decisions when planning compensation for international teams.

Are the salary estimates exact or indicative?

The results are estimates based on available salary data and benchmarks. Actual salaries may vary depending on factors such as experience level, company size, industry, and benefits offered. The calculator should be used as a reference point for compensation planning.

Why is benchmarking salaries across countries important?

Benchmarking helps companies ensure their compensation packages are competitive and aligned with local market standards. It also helps businesses manage budgets effectively while attracting and retaining talent in different regions.